RUNNING MRTG
You are now ready to collect data with MRTG.
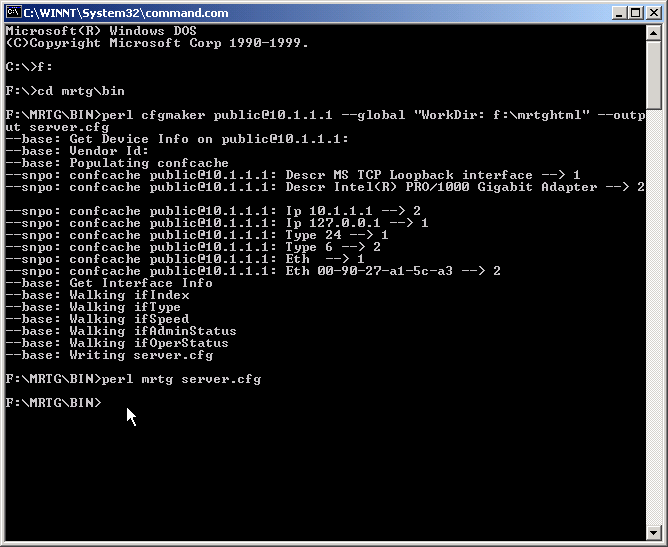
At the command prompt, type
perl mrtg server.cfg
substituting the name of your cfg file as needed.

You have now collected your first data. Wait about 5 minutes and run the same command again.
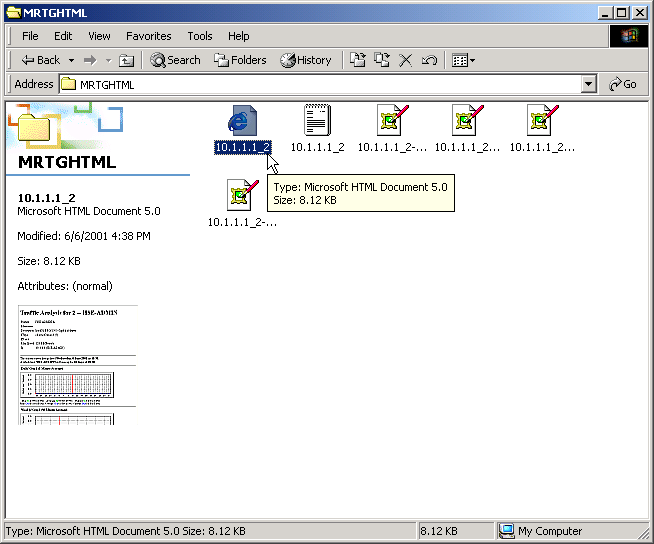
Navigate to the mrtghtml directory created earlier and open the web page. It should be defined as the device IP and interface number. If you did a something with multiple active interfaces, you will have many web pages.
Double click to open the web page in Internet Explorer (or your default
browser).

Your web page will look close to mine. CLICK HERE. Notice the Daily Graph has the start of a graph on the left edge. Also, there is data directly below the graph which represent the traffic levels. If you scroll down to the bottom, you will find some broken picture links.
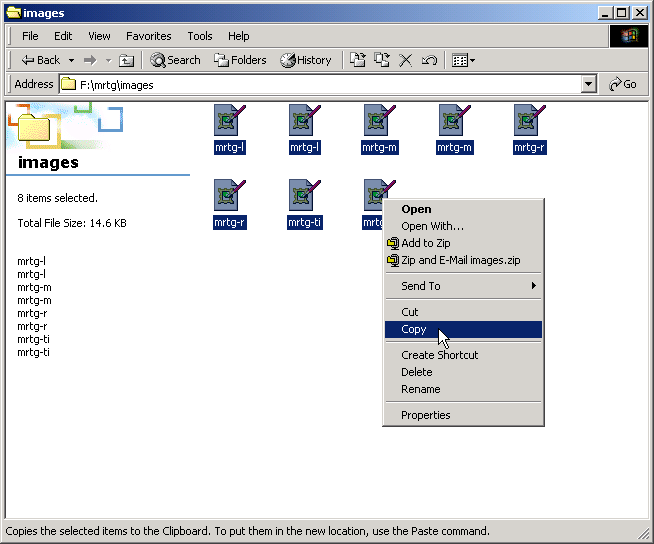
Here is how to fix them. Navigate to the \mrtg\images directory. Select all images and copy.

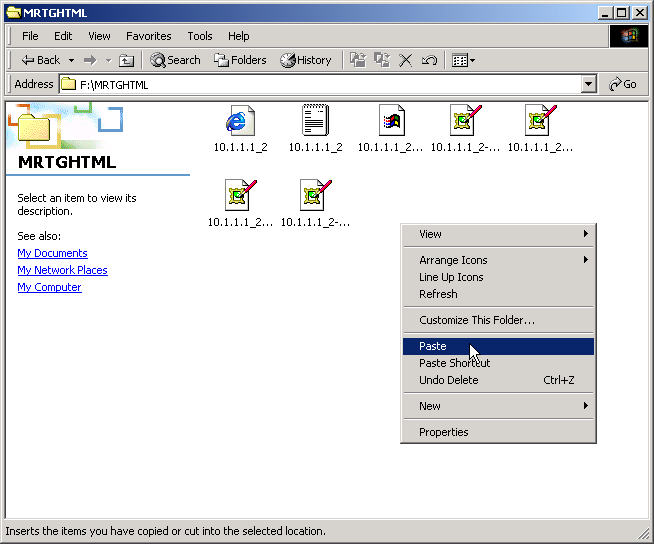
Navigate to the \mrtghtml directory and paste. The problem is now fixed. Refresh the web page in the browser to see the corrected image links.

Lets progress to collecting data 24 X 7 X 365.